


From: Marcus & Millichap
Medical Office Research | National Report
Third Quarter 2016
Expanded Insurance Coverage, Aging Population Broaden Outlook
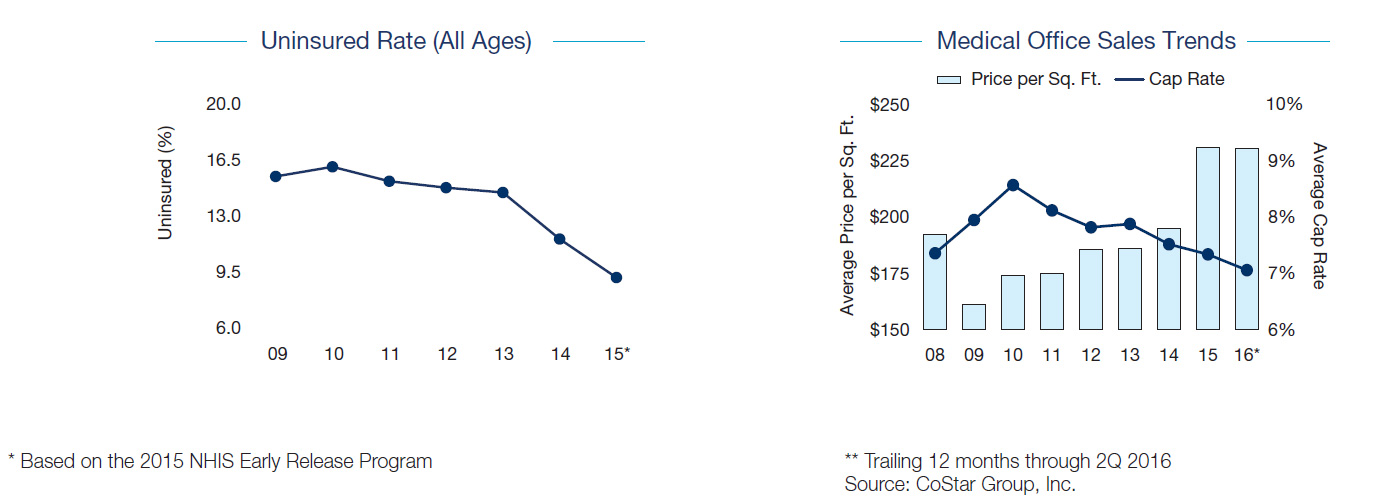
ACA widens number of insured individuals, increases need for medical services. Expanded healthcare coverage and an aging population are boding well for the nation’s medical office building segment. Since the inception of the Affordable Care Act (ACA), medical insurance coverage has extended to nearly 90 percent of the U.S. population, up from a low of approximately 84 percent in 2010. This, combined with the aging of our nation’s baby boomer generation as they move closer to their golden years, is increasing the need for medical services across the country. Healthcare providers are moving to- ward a more patient-centered model, placing medical facilities in retail-like settings and into local communities, capitalizing on strong traffic and demographic patterns and providing patients with easier access to healthcare. Rising demand for healthcare services will bode well for the medical office building segment, though a potential physician shortage, rising popularity of in-store clinics and telemedicine, and industry consolidation will remain influences on the market.
Health systems play large role in lease negotiations, development. Hospital acquisitions of private practices and healthcare systems’ move of outpatient services away from
hospital campuses are leaving major medical providers in control of a large share of leasing activity. As a result, buildings with modern amenities and flexible floor plans are in high demand, boosting the construction pipeline and contributing to a rise in completions this year. As the majority of space demand is funneled into recently constructed and newer vintage buildings, earlier-vintage assets and outdated buildings will bear the brunt of attrition as physicians retire and acquired practices are consolidated into newer space.
Favorable outlook attracts investors, facilitates a rise in sales activity. Deal flow accelerated 17 percent during the trailing 12 months ending in June, while the average price has advanced 17 percent since the end of 2014 to $230 per square foot as heightened interest has increased buyer competition and compressed cap rates. Institution al-grade properties, in particular, have realized a substantial uptick in velocity in recent quarters, and price appreciation during this time has been driven by a rise in sales of these Class A buildings.
Crossover capital increasing demand for medical office assets. A rise in cross- over capital is also contributing to an advance in transaction velocity as a number of single-tenant retail investors target similar investment opportunities in the medical office segment. In addition, several REITs and large funds that typically invest in the seniors housing sector are diversifying portfolios and placing large sums of capital into medical office buildings. Meanwhile, other medical office investors who previously targeted stabilized assets in core markets are purchasing value add properties and participating in development opportunities and equity placement.
Cap rates vary depending on a number of factors. As sales of on-campus properties are limited, many buyers are focusing on off-campus assets. On-campus buildings that do change hands command sub-6 percent initial yields for single-tenant buildings while multi-tenant properties draw first-year returns in the mid-6 percent to low-7 percent range. Off-campus properties with strong tenancy, including a healthcare system and long remaining lease terms, are in high demand and sell for a premium, commanding cap rates in the mid-6 percent area. Other types of off-campus medical office buildings, including those in need of repositioning or located in secondary or tertiary markets, can trade with first-year yields up to 200 basis points higher.
Developers Target Off-Campus Locations
More than 3.5 million square feet of medical office space was delivered in the first six months of the year, and builders are set to bring approximately 11 million square feet of medical office space online in 2016. Healthcare providers continue to push into communities as the sector shifts to a more patientcentric care delivery model, encouraging a number of off-campus projects. Standalone emergency departments and large medical office buildings with several physician and outpatient services make up a significant portion of these off-campus developments. Both small and large providers, from private primary care physicians to ambulatory care facilities, are also taking space in traditional retail establishments such as strip centers, vacated malls and empty big-box spaces. In addition, on-campus medical office space continues to rise as hospitals expand or replace existing buildings and add specialized facilities, such as cancer and critical centers, to their campuses.
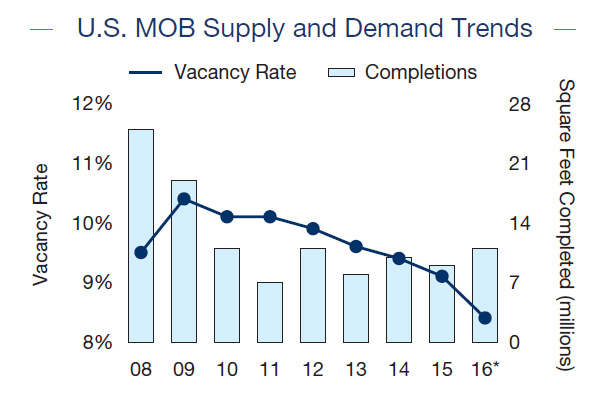
Demand Rises, Pushes Vacancy to 9-Year Low
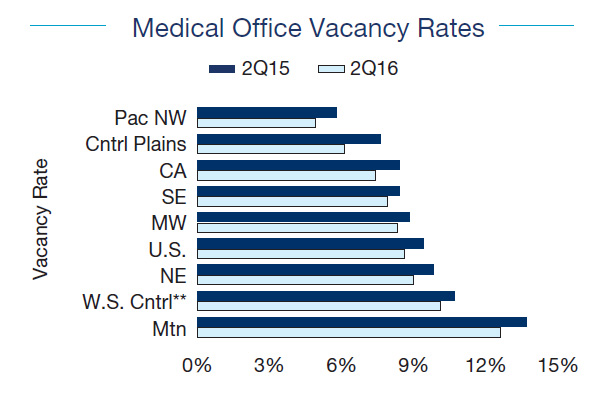
Medical office vacancy tightened to the lowest level since early 2007, reaching 8.6 percent in the second quarter, down 80 basis points over the last 12 months and the strongest decline recorded in nearly 10 years. All eight regions realized a year-over-year decrease in the rate, with the Pacific Northwest Region posting the lowest vacancy in the country at 4.9 percent, falling 90 basis points from the middle of last year. Meanwhile, the Mountain Region formed the higher end of the spectrum despite a 110-basis-point annual fall in vacancy to 12.6 percent. The Phoenix, Las Vegas and Tucson metros have some of the highest medical office vacancy rates in the country, at over 16 percent in each market, which kept overall vacancy inflated for the region despite strong declines over the last four quarters. Vacancy ranged from a low of 6.1 percent to a high of 10.1 percent in the remaining six regions.
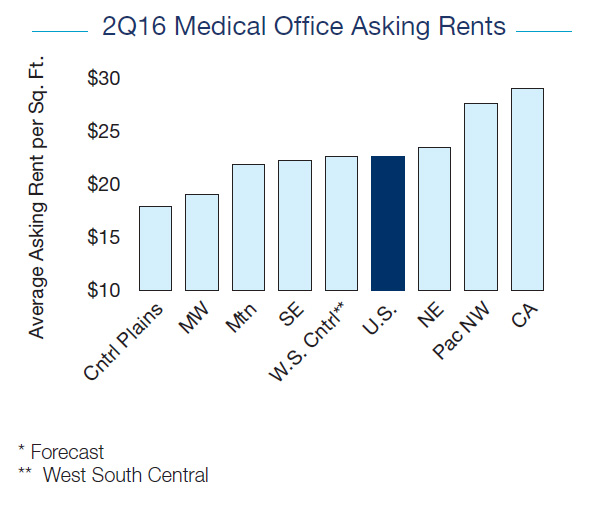
Rent Advances Amid Tightening Conditions
Asking rents for medical office space remain on a modest incline, ticking up 0.2 percent over the last year to $22.61 per square foot in the second quarter. Slight advances were recorded in six regions, with the strongest increase realized in the Central Plains where the average rose 1.2 percent to $17.91 per square foot. Advances ranged from 0.3 percent to 0.8 percent in the five remaining regions where rent increased over the last year. Rental rates declined in two regions during the last four quarters, with the average falling 2.4 percent in the Pacific Northwest, led by a 2.6 percent dip in the Seattle-Tacoma metro. The average rent in the Midwest pushed down 0.1 percent year over year in June, though several major metros in this region posted gains of more than 2 percent. The average asking rent remains highest in California, rising above $29 per square foot in June. More than half of the major markets in this region recorded rent above $30 per square foot during the period, including San Francisco, San Diego and Los Angeles.
Rent, vacancy and construction averages/totals based on properties of 20,000 square feet or more. Sales figures based on properties with a minimum of 10,000 square feet that traded for $1 million or more. Comparisons with previous reports may not align due to data revisions and periodic re-bench- marking. The information contained in this report was obtained from sources deemed to be reliable. Every effort was made to obtain accurate and complete information; however, no representation, war- ranty or guarantee, express or implied, may be made as to the accuracy or reliability of the information contained herein. Sources: Marcus & Millichap Research Services; AAMC; Bureau of Labor Statistics; CBO; CDC; CoStar Group, Inc.; Moody’s Analytics; Real Capital Analytics; U.S. Census Bureau; NHIS.
Credit:
Marcus & Millichap
Medical Office Research
National Report
Third Quarter 2016
Healthcare Real Estate Group
Alan Pontius
Senior Vice President | National Director
Tel: (415) 963-3000 | [email protected]
Prepared and edited by
Jessica Hill
Market Analyst | Research Services
For information on national medical office trends, contact:
John Chang
First Vice President | Research Services
Tel: (602) 687-6700 | [email protected]
For more information on DST/TIC 1031 Exchange Replacement Properties contact Corcapa 1031 Advisors (949) 722-1031 or complete the contact form below.
"*" indicates required fields